







In general
The university of Florence has developed a software for rendering images called aRt (another ray tracer). This software it's been fully developed by computation geometry students from year to year. The algorithm that I've worked on (photon mapping revisited), developed under the supervision of Alberto Mancini, adds to aRt an important element: the capability of representing the inter-reflection effects, that is actually a limit of the ray tracer itself. This algorithm was developed starting from the one presented by T. Hachisuka, S. Ogaki and H. W. Jensen in this report "Progressive photon mapping" in the 2008.
More specifically
The Photon Mapping Revisited is an adaptation of the Progressive photon mapping to aRt, and it's, actually, a variation of the reverse photon mapping, that optimizes the main steps. The first one is a ray tracing step in which we store all the intersections considering also rays reflections and refractions until the first non-reflecting and non-refracting surface. Along with these intersections we also store other elements that we process in the second step of the algorithm to calculate the right radiance in that point. Therefore at the end we get an image that shows the caustic effects as well.
Further updates
Save-and-Load
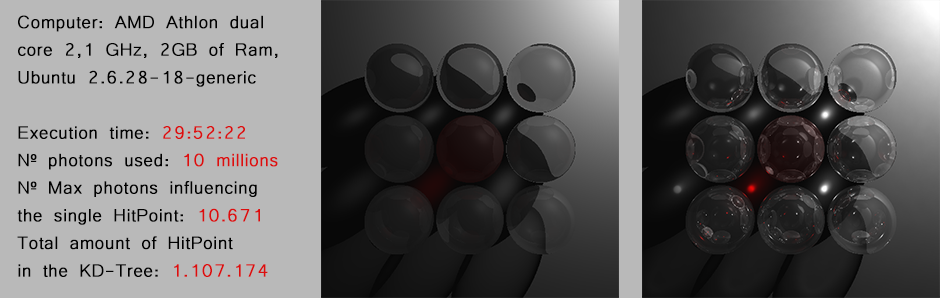
As you can see form the image above the algorithm is quite slow for images with high resolution (N° of photons). In order to get all the data faster I've implemented a save-and-load feature that allows to store the result in a file, kind of a database, and load it back in about 7 sec (instead of 24 hours like in the most complex one).
Parallelization
Another feature is the possibility to split the computation in equal parts among a given number of computers, storing the partial result of each one and merge all of this results in a final one. This was made in order to computate again the final result, if needed, but way faster.
Slider
In the slider you can see the difference between the images generated from the software before the integration of my algorithm and the ones after.
Slide 1
It's the most complex image we built to test on. 9 glasses balls
Slide 2
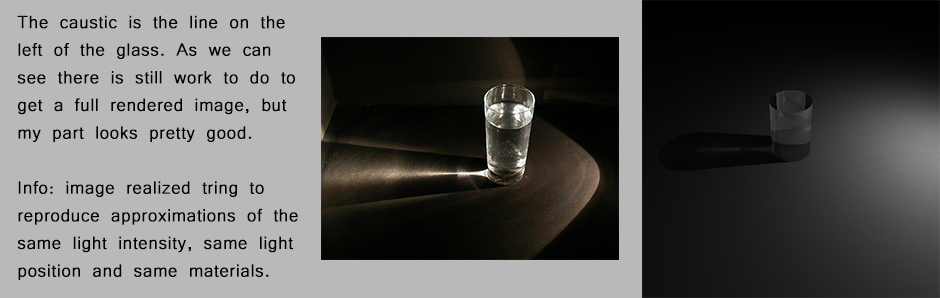
It's the comparison between a real picture and the image resulting of my algorithm. It's interesting to notice how close they look like expecially for the part concerning the caustic
Slide 3
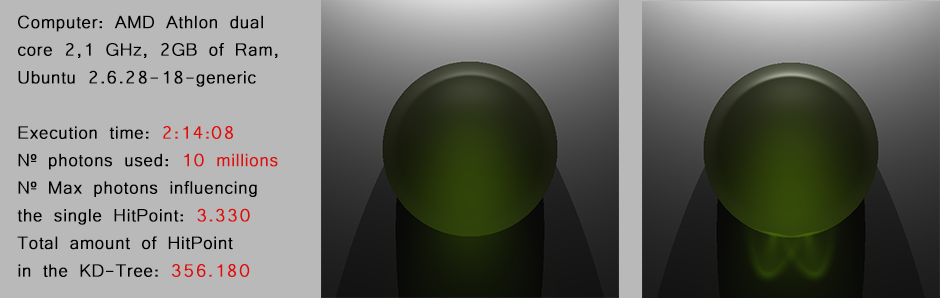
There is a ball made out of glass with a green shade and 2 lights at the top center, to show the interaction between two overlapping caustics
Links
It's possible to download the pdf of my thesis here